Construction Margin Control System
Which of your jobs is losing money — while you can still do something about it.
Most contractors learn that a job lost money when the final account is agreed. By then it is gone. This workbook compares two clocks on every job — how much of the budget you have spent, and how much of the work is actually built — and forecasts the real final cost from the rate you are genuinely working at, not from the rate you priced. It then splits the lost margin into eight named causes in money, scores each job 0 to 100 with every component visible, and hands you the three things to do this Monday, ranked. Ships with six worked jobs so it runs before you type anything.
What's inside
Start Here & Settings
About thirty minutes, once. Currency, data date, your approval and recovery rates on variations, your cost of money, your collection days, and the amber and red thresholds behind every score — plus regional presets for the UK, North America and the Gulf so you know what to type — nothing in that block is read by a formula, you copy from it. Every other sheet reads from here.
Jobs & Weekly Entry
Jobs holds the contract and the estimate you won it on, split five ways — that split is what makes the erosion engine work. Weekly Entry is the only sheet you touch: five cost lines, physical % complete, billed, received, weeks behind.
Portfolio
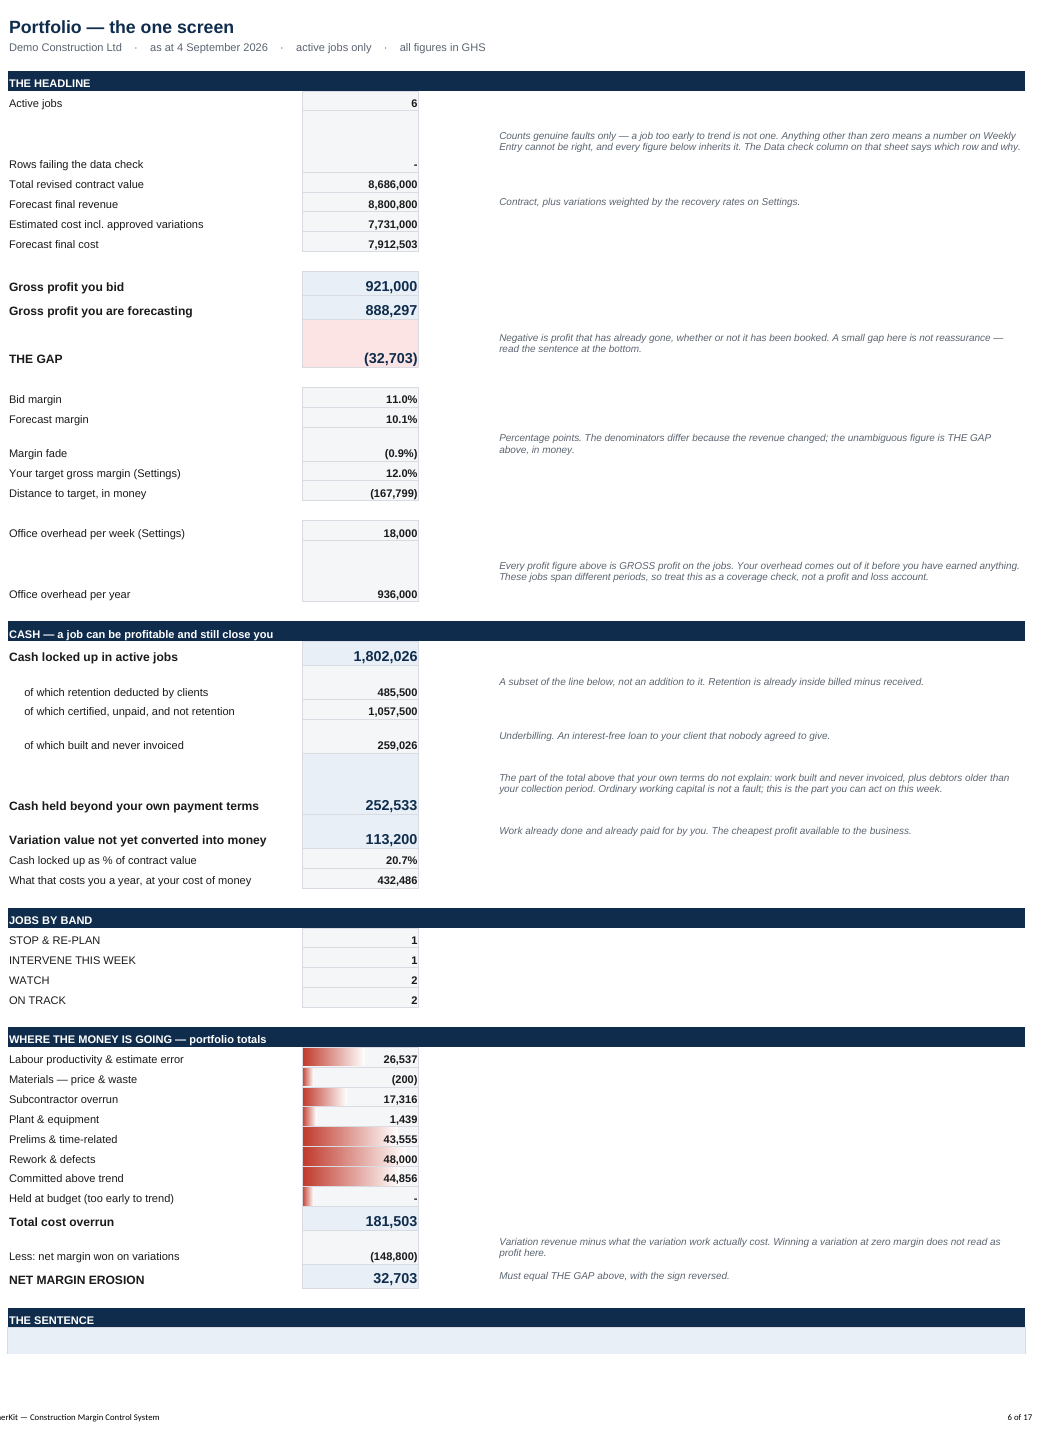
The one screen. Profit you bid against profit you are forecasting, the gap in money, cash locked up and what it costs you a year, jobs by band, and a sentence naming the job doing the most damage.
Action Centre
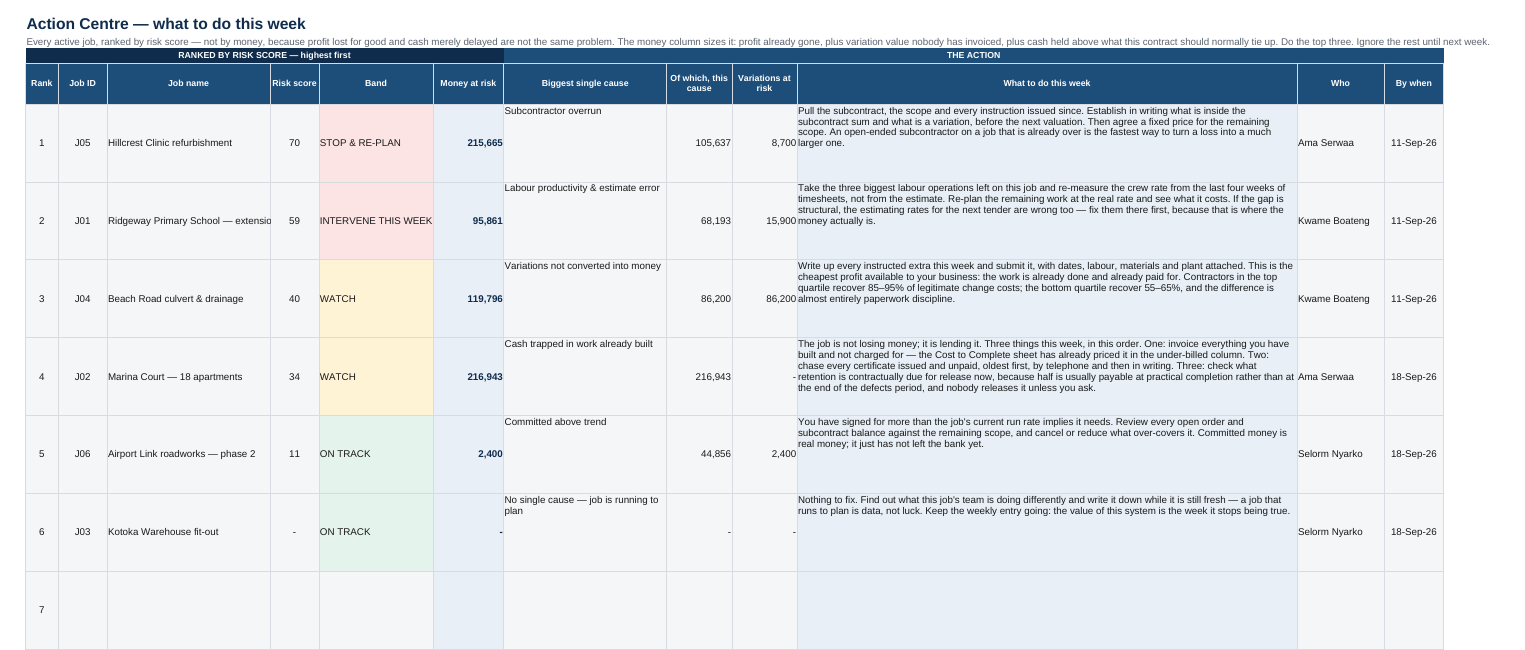
Every live job ranked by risk, each with its biggest single cause, the money at risk, a written action for the week, the project manager responsible and a date. Do the top three.
Cost to Complete & Margin Erosion
The engine, fully exposed: divergence, cost performance index, forecast final cost, cost to complete, over and under billing, fade against the bid, and the eight causes reconciled to the penny.
Risk Score, Cash Timeline & Method
Six scored components against your own thresholds; thirteen weeks of cash from the jobs themselves; and a Method sheet that writes out every formula in plain English, names its sources, and lists the five data-quality checks to run before you trust a number.
Questions
I am in the United States — do you use American terms?
The workbook is written in British contract English, because that is the language of JCT, NEC and FIDIC, and FIDIC is the basis of most contracting outside North America. The Method sheet carries a full translation table: variation is change order, prelims are general conditions, retention is retainage, programme is schedule, interim payment certificate is pay application, final account is closeout. Nothing but the wording differs. You can rename any header with one exception: the Action Centre matches the cause names in the Method table to decide what to tell you to do, and eight of those are also the column headers on Margin Erosion, so if you rename one of those, rename it in both places.
Does it fit FIDIC contracts in the Gulf?
Yes, and the vocabulary is already native: variations, prelims, retention, interim payment certificates, taking-over. Settings carries a regional reference table for the Gulf — 60–90 collection days, 10% retention capped at 5% of the contract sum, half released at the Taking-Over Certificate and the balance after the Defects Notification Period — alongside the UK and Ireland and the United States and Canada, so you are not guessing at the numbers every cash figure depends on. It is a table you read and copy from: the workbook does not apply the cap or any regional rule for you, and it says so on the sheet.
Can I try it before I buy it?
Yes. The free demo is the real workbook — the same six worked jobs, the complete engine and the complete Method sheet. It carries 2,572 of the full version’s 2,812 formulas; the 240 it does not carry are the empty job rows the demo does not open. The sheets are locked so you cannot type into it. No email required. If it does not convince you in ten minutes, do not buy it.
How is this different from a free WIP template?
A WIP schedule reports what already happened: percent complete from cost, earned revenue, over and under billing. It cannot tell you why the margin moved, and because it takes progress from cost, overspending makes a job look further along. This workbook takes physical progress from the site as a separate input, so the gap between the two becomes the warning — and then it attributes the lost margin to named causes, scores each job with every component visible, and writes the week’s action.
What do I have to produce that I do not already have?
One number: physical % complete per job, from the site. Everything else — costs to date by category, billed, received, retention, weeks behind, open commitments — you already have. The estimate split five ways comes from your tender build-up.
How long does it take each week?
About fifteen minutes of typing on a Monday for ten jobs, and ten more once a month for commitments, variations and last month's forecast snapshot. That is typing time: judging physical % on site is the real work, and the Start Here sheet says so. Setup is about thirty minutes, once.
How many jobs does it hold?
Thirty live jobs. If you run more than that at once, write to me through the contact form before you buy and tell me how many, so you are not disappointed.
Does it work in Google Sheets?
Yes. Upload the .xlsx to Drive and open with Sheets. Formulas, dropdowns and conditional formatting carry over; the data bars on the Portfolio sheet are the one thing Sheets does not reproduce. It also opens in LibreOffice. There are no macros or add-ins to break.
What happens on a job that has only just started?
Below the minimum physical % you set on Settings (15% by default), the workbook refuses to extrapolate and holds the forecast at budget, saying so in the Forecast basis column. Cost divided by physical % is violently unstable when physical % is small, and no site manager can reliably tell 5% from 6%. Treat early-job figures as a placeholder, not a warning.
Will it tell me my job is losing money when it is not?
It reports what your numbers say, and it shows every step. If a score looks wrong, the Risk Score sheet shows which of the six components produced it and the Settings sheet holds the threshold that scaled it — change the threshold and watch the number move. The Method sheet writes out every formula in words so you can check the arithmetic yourself.
Is it accounting software?
No, and it does not replace your accountant, your quantity surveyor or your accounting system. It is a decision tool: it reads figures you already produce and tells you which job needs you this week.
How this was built, and what it is not
Every formula in the workbook is written out in plain English on its Method sheet, and the benchmark figures name what they actually rest on — construction-finance publications reporting industry benchmarking for margin quartiles, change-order recovery rates and collection days, and the published literature on the causes of margin fade. Those are secondary sources and the sheet says so. Nothing is hidden behind a score you cannot take apart.
What it is not: it is not accounting software, it does not replace your accountant or your quantity surveyor, and it cannot forecast a job that has barely started — below 15% complete it says so and holds the forecast at budget instead of guessing.
Built by Jamil Abduljalil, who trades as OwnerKit from Accra, Ghana. There are no customer testimonials on this page because there are no customers yet. That is why the demo is free, complete and ungated: judge it yourself rather than taking anyone’s word.
Try it before you buy it
Take the workbook. It is the real thing with the six worked jobs, every formula visible and the Method sheet in full — locked so you cannot type into it, so you can see exactly what it does before you spend anything. No email required.